Episode 0x10: Prometheus, Alert Manager and Grafana
Table of Contents
NOTE: Many commands in this post make use of specific constants tied to my own setup. Make sure to tailor these to your own needs. These examples should serve as a guide, not as direct instructions to copy and paste.
NOTE: Check out the final code at homelab repositories on my Github account.
Introduction
Having a functioning weblog is one thing; gaining insights from it is another. Leveraging Prometheus for metrics collection and Grafana for visualization, we can create an insightful dashboard for our weblog.
Installation
We’ll install the Prometheus stack using its community Helm charts via an Argo CD application. First, add the following application configuration to your apps.yaml file:
- apiVersion: argoproj.io/v1alpha1
  kind: Application
  metadata:
    name: kube-prometheus-stack
    namespace: argocd
  spec:
    project: default
    source:
      repoURL: https://prometheus-community.github.io/helm-charts
      chart: kube-prometheus-stack
      targetRevision: 60.3.0
      helm:
        releaseName: kube-prometheus-stack
        values: |
          namespaceOverride: monitoring
          grafana:
            ingress:
              enabled: true
              ingressClassName: nginx
              annotations:
                cert-manager.io/cluster-issuer: "letsencrypt-prod"
                acme.cert-manager.io/http01-edit-in-place: "true"
                nginx.ingress.kubernetes.io/ssl-redirect: "true"
              hosts:
                - grafana.<your-domain>.com
              tls:
                - hosts:
                    - grafana.<your-domain>.com
                  secretName: grafana.<your-domain>.com-tls
              path: /
    destination:
      namespace: monitoring
      server: https://kubernetes.default.svc
    syncPolicy:
      syncOptions:
        - CreateNamespace=true
        - ServerSideApply=true
This configuration will install the Prometheus stack in the monitoring namespace. It also sets up the Grafana ingress, allowing us to access Grafana later on. For Prometheus, no ingress configuration is needed; its web UI can be accessed via port-forwarding.
Apply this configuration with:
kubectl apply -f apps.yaml
Next, change the Grafana admin password:
argocd app set kube-prometheus-stack -p 'garafana.adminPassword=<grafana-admin-password-here>'
Test Prometheus
To verify Prometheus, port-forward from your machine to the Prometheus service:
kubectl port-forward -n monitoring svc/kube-prometheus-stack-prometheus 9090:9090
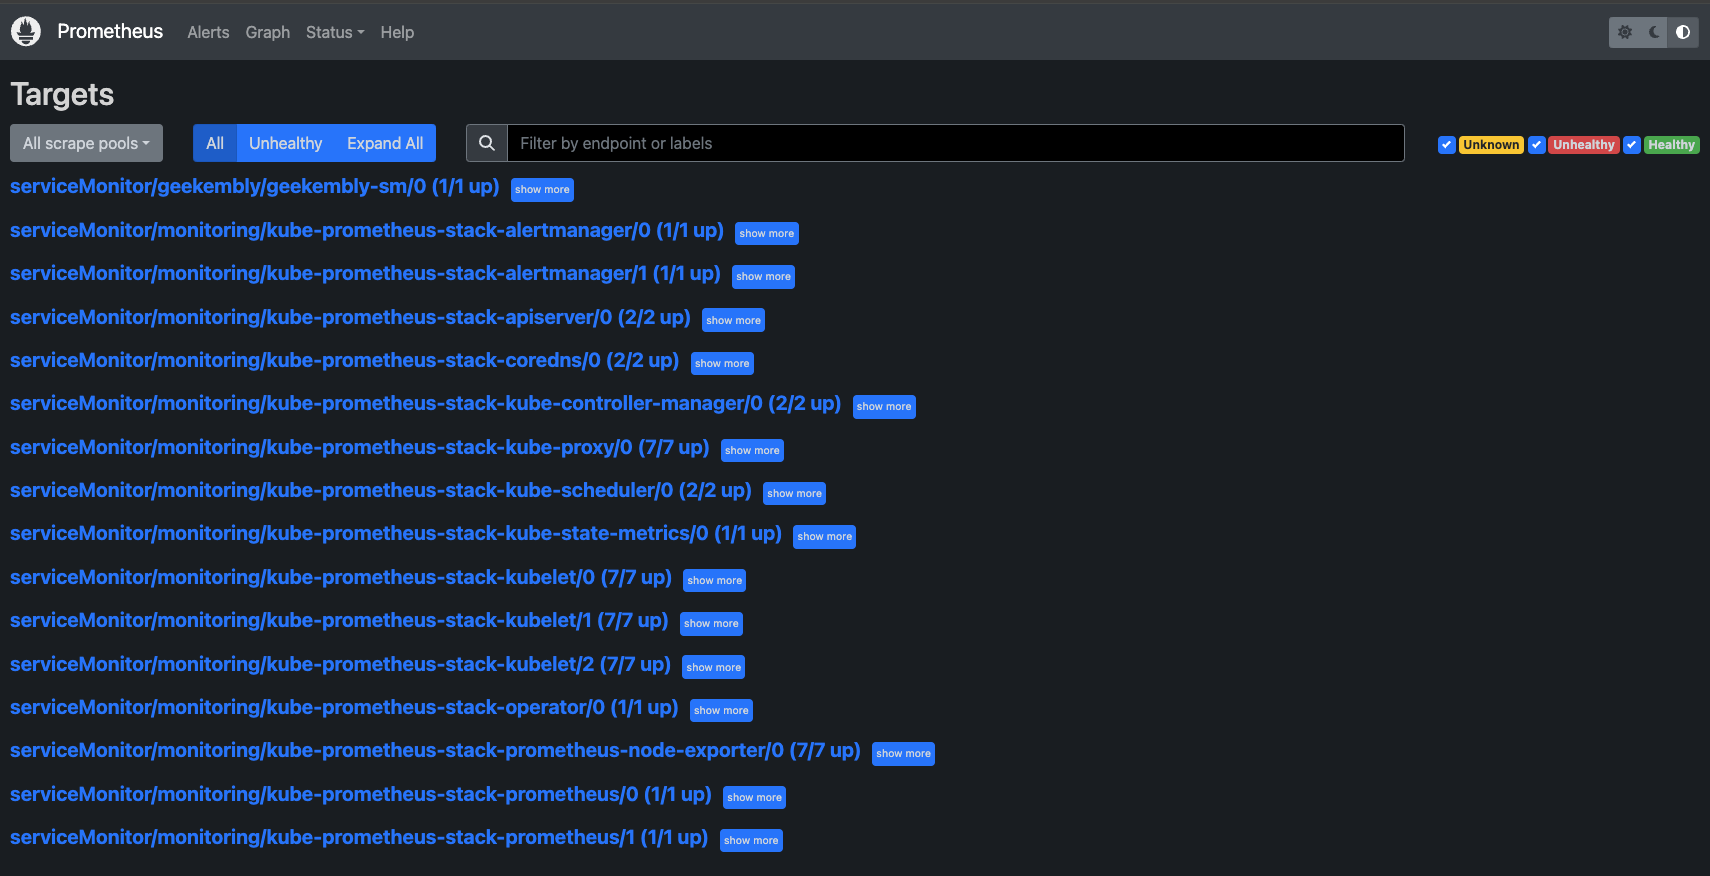
Visit https://localhost:9090 in your browser. Navigate to Status > Targets to view the configured targets, which should be already set up.

If the kube-proxy target does not appear healthy, modify its configuration to bind metrics on all interfaces:
kubectl edit cm -n kube-system kube-proxy
Change metricsBindAddress: 127.0.0.1:10249 to metricsBindAddress: 0.0.0.0:10249.
Test Grafana
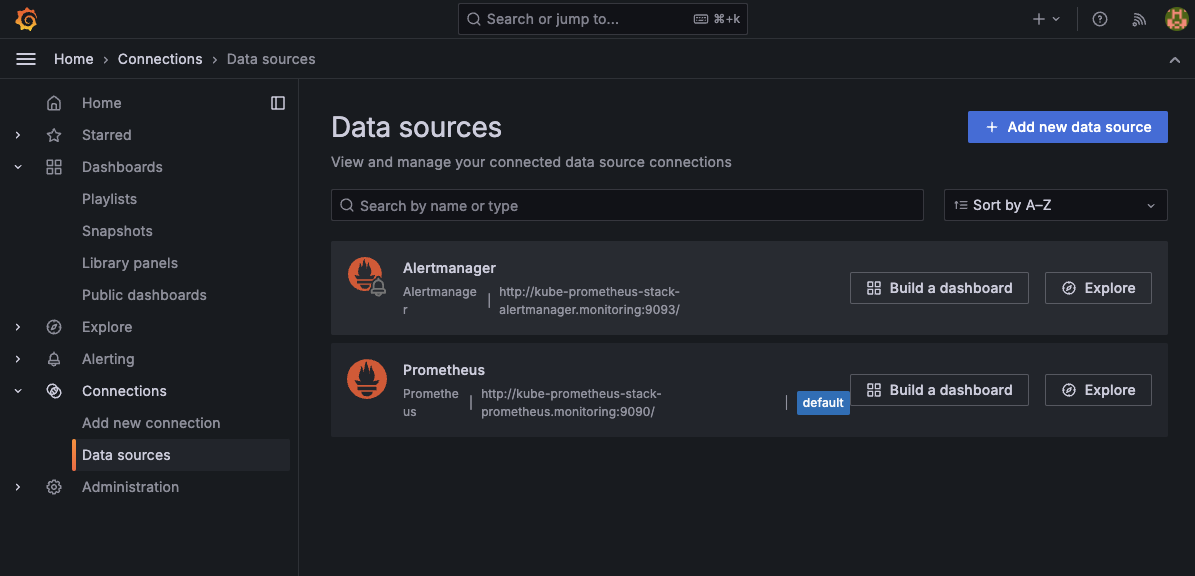
Open your browser and navigate to https://grafana.<your-domain>.com. Log in using your admin credentials. You should see Alertmanager and Prometheus already listed as data sources.

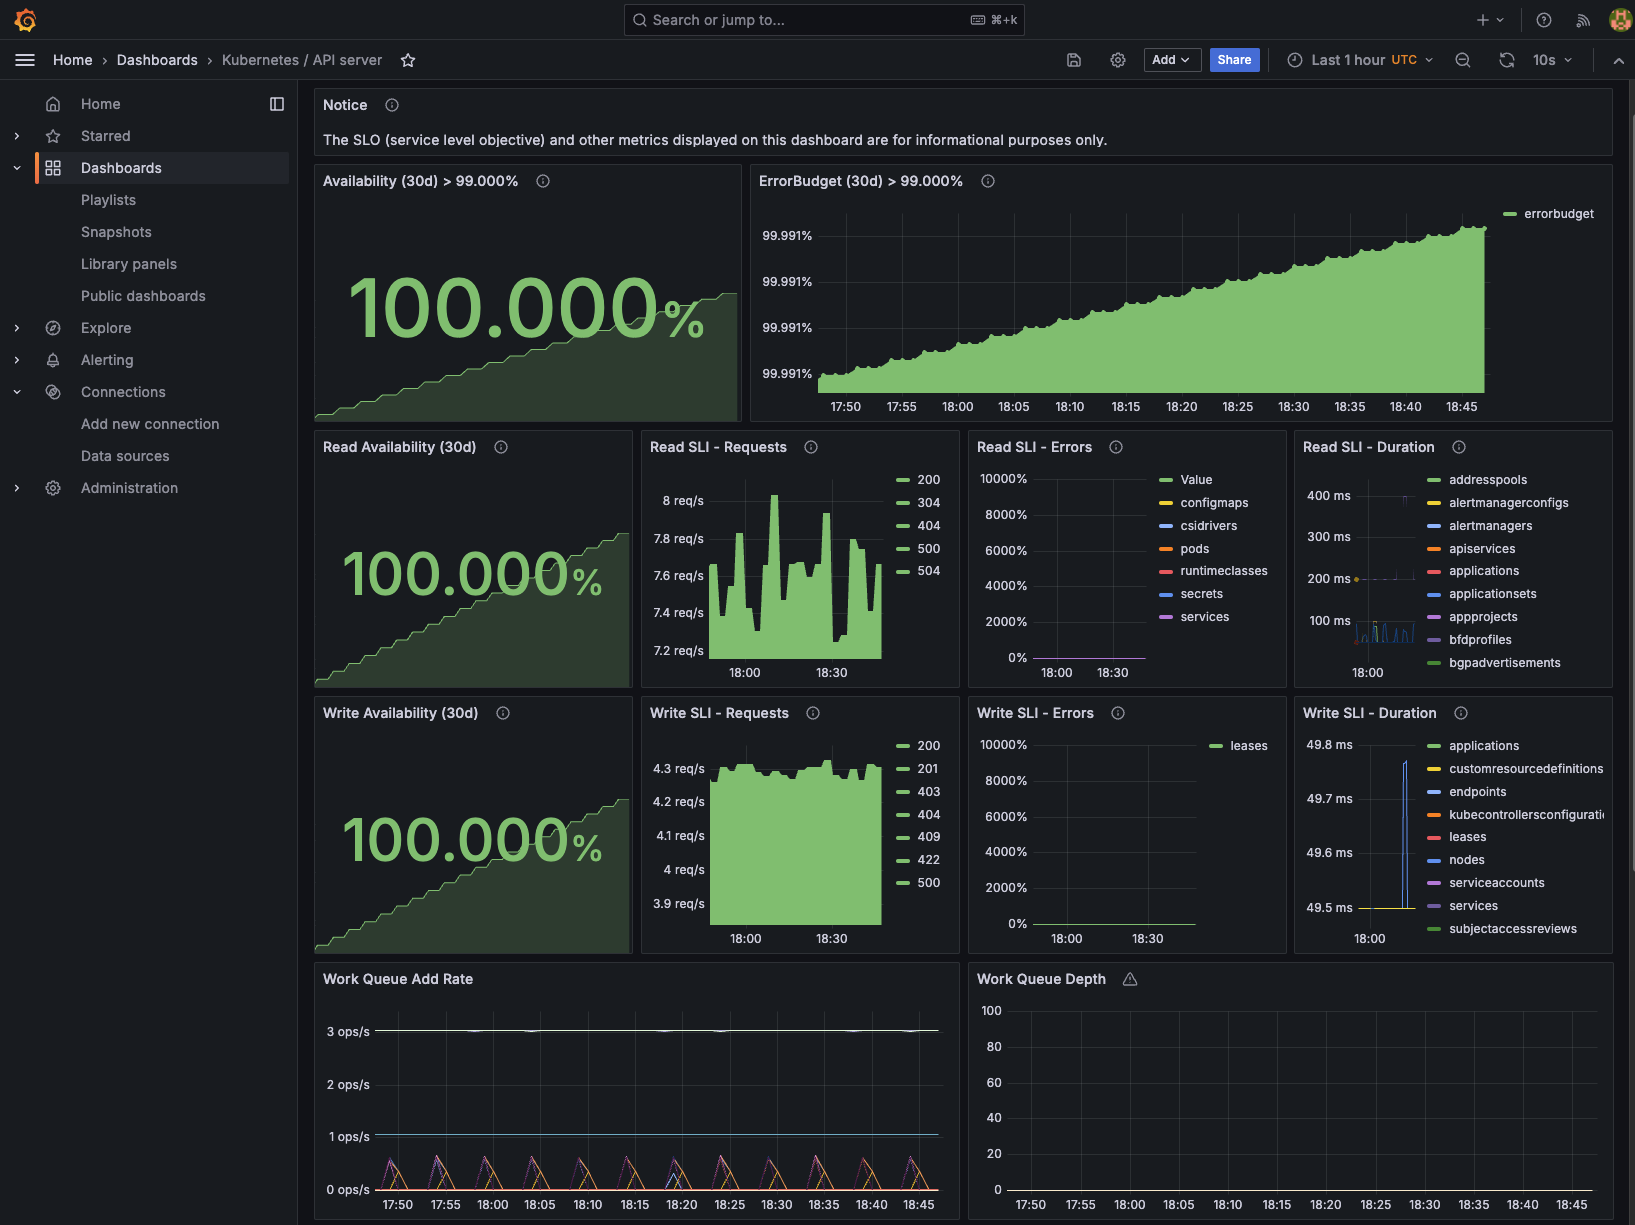
Additionally, some default dashboards should be pre-configured.

Geekembly Metrics
Prometheus Nginx Exporter
To gain insights from our weblog, Geekembly, we’ll configure an Nginx Prometheus exporter to expose Nginx metrics.
Add the Nginx exporter as a sidecar to your current deployment by modifying your deployment.yaml as follows:
apiVersion: apps/v1
kind: Deployment
metadata:
  name: geekembly-dpl
spec:
  selector:
    matchLabels:
      app: geekembly
  replicas: 1
  template:
    metadata:
      labels:
        app: geekembly
    spec:
      containers:
        - name: geekembly
          image: geekembly:latest
          ports:
            - containerPort: 80
              name: http
          volumeMounts:
            - name: nginx-config
              mountPath: /etc/nginx/conf.d/nginx_status.conf
              subPath: nginx_status.conf
        - name: nginx-exporter
          image: nginx/nginx-prometheus-exporter:latest
          args:
            - -nginx.scrape-uri=http://localhost:8080/stub_status
          ports:
            - containerPort: 9113
              name: metrics
      volumes:
        - name: nginx-config
          configMap:
            name: nginx-config
      imagePullSecrets:
        - name: regcred
---
apiVersion: v1
kind: ConfigMap
metadata:
  namespace: geekembly
  name: nginx-config
data:
  nginx_status.conf: |
    server {
        listen 8080;

        location /stub_status {
            stub_status;
            allow all;
        }
    }
---
apiVersion: v1
kind: Service
metadata:
  name: geekembly-svc
  labels:
    app: geekembly
spec:
  ports:
    - port: 80
      name: http
      protocol: TCP
    - port: 9113
      name: metrics
      protocol: TCP
  selector:
    app: geekembly
The Nginx exporter exposes metrics on port 9113 for Prometheus to scrape, while Nginx exports stub_status on port 8080.
Next, configure Prometheus to scrape this new endpoint using a custom resource definition (CRD) called ServiceMonitor. Create a servicemonitor.yaml file with the following content:
apiVersion: monitoring.coreos.com/v1
kind: ServiceMonitor
metadata:
  labels:
    release: kube-prometheus-stack
  name: geekembly-sm
  namespace: geekembly
spec:
  endpoints:
    - port: metrics
      interval: 30s
  selector:
    matchLabels:
      app: geekembly
Apply all these configurations, then navigate to the Prometheus targets page to verify the new target for your weblog is active.
Grafana Dashboard
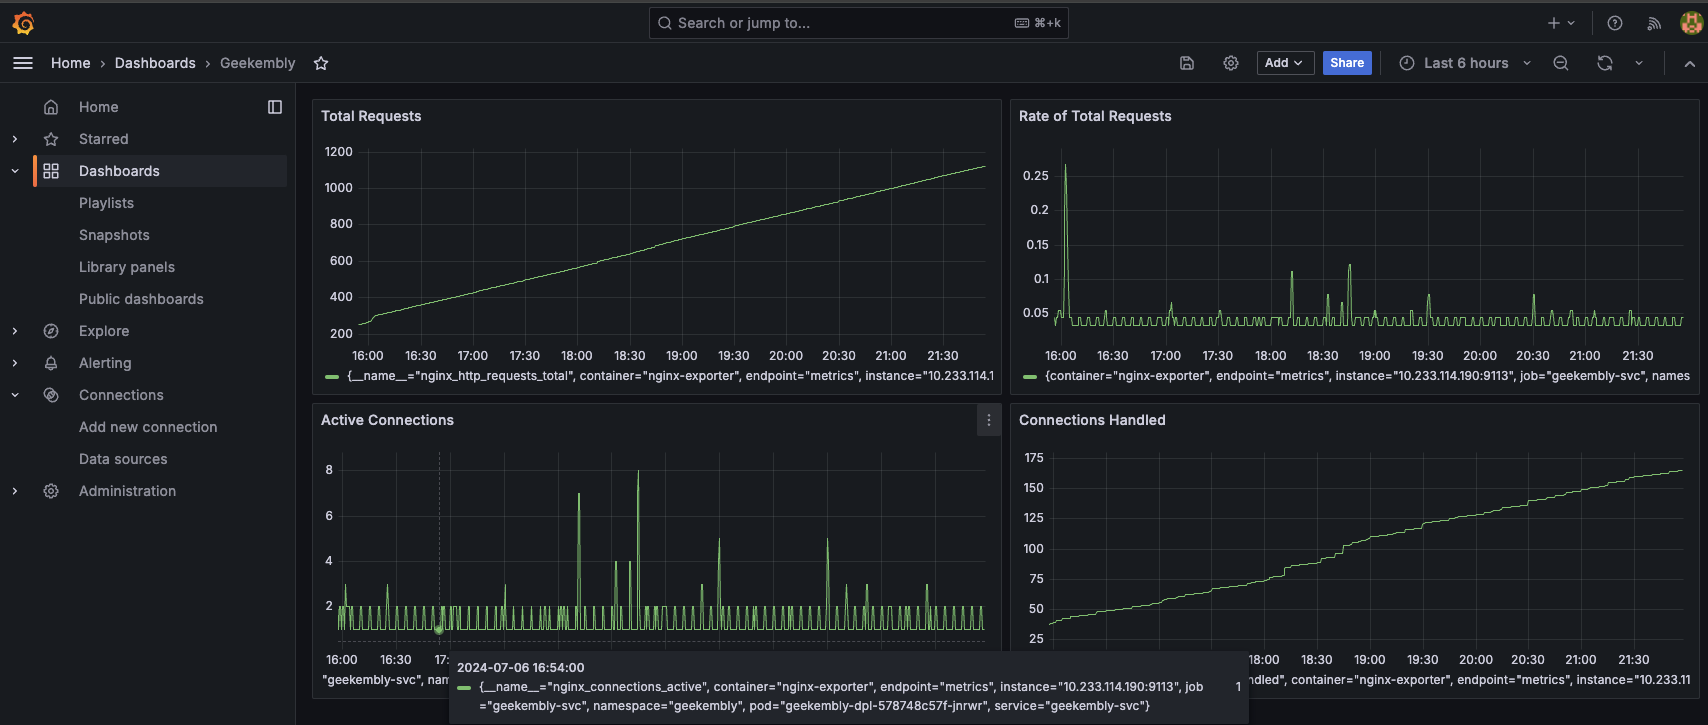
Now that Prometheus collects Nginx metrics, we can create a Grafana dashboard to visualize them.
- Navigate to
Grafana > Dashboards > New Dashboard > Add Visualization. - Select Prometheus as the data source.
- Add
nginx_http_requests_totalas a metric and set the title toTotal Requests. - Save the dashboard.
Similarly, you can add visualizations for total HTTP requests rate, active connections, and connections handled.

Conclusion
We’ve successfully set up a comprehensive monitoring solution using Prometheus for metrics collection and Grafana for visualization. This setup allows us to gather and analyze data from our weblog and the cluster in which it runs. In the next episode, we’ll integrate Grafana Loki and Alloys for log collection and visualization. Stay tuned! 🚀