Episode 0x11: Capturing and Exploring Logs with Loki and Alloy
Table of Contents
NOTE: Many commands in this post make use of specific constants tied to my own setup. Make sure to tailor these to your own needs. These examples should serve as a guide, not as direct instructions to copy and paste.
NOTE: Check out the final code at homelab repositories on my Github account.
Introduction
Congratulations on making it this far! So far, we’ve set up a working CI/CD pipeline, deployed our web log on the home lab, and configured dashboards to monitor its metrics, as well as the home lab itself. But there’s one last piece left before we can call this series complete: managing container logs.
While there are many log management solutions available, we will leverage the Grafana stack by using Loki and Alloy, which belong to the same ecosystem. Think of Loki as the Prometheus for logs. Instead of pulling and gathering metrics, it processes logs pushed to it. Grafana Alloy (the successor of Promtail) will help us tail and send logs to Loki.
Installation
Grafana Loki
We’ll install Loki using its community-supported Helm charts within an Argo CD app. We’ll keep it in the monitoring namespace with Grafana and Prometheus, configuring it to use our Minio Object Storage for persistence.
First create the following 3 buckets:
mc mb admin/loki-admin
mc mb admin/loki-chunks
mc mb admin/loki-ruler
Next, we’ll need a Minio Access Token for Loki. You can create one using the steps mentioned in episode 13.
Update apps.yaml to deploy Loki:
- apiVersion: argoproj.io/v1alpha1
  kind: Application
  metadata:
    name: loki
    namespace: argocd
  spec:
    project: default
    source:
      repoURL: https://grafana.github.io/helm-charts
      chart: loki
      targetRevision: 6.6.4
      helm:
        releaseName: loki
        values: |
          global:
            clusterDomain: homelab-k8s
            dnsService: coredns
          deploymentMode: SingleBinary
          loki:
            auth_enabled: false
            commonConfig:
              replication_factor: 1
            storage:
              bucketNames:
                chunks: loki-chunks
                ruler: loki-ruler
                admin: loki-admin
              type: 's3'
              bucketNames:
                chunks: loki-chunks
                ruler: loki-ruler
                admin: loki-admin
              s3:
                endpoint: minio-svc.minio:9000
                region: us-east-1
                s3ForcePathStyle: true
                insecure: true
            schemaConfig:
              configs:
              - from: "2024-01-01"
                store: tsdb
                index:
                  prefix: loki_index_
                  period: 24h
                object_store: s3
                schema: v13
          chunksCache:
            allocatedMemory: 1024
          singleBinary:
            replicas: 1
          read:
            replicas: 0
          backend:
            replicas: 0
          write:
            replicas: 0
    destination:
      namespace: monitoring
      server: https://kubernetes.default.svc
    syncPolicy:
      syncOptions:
        - CreateNamespace=true
        - ServerSideApply=true
Provide Minio credentials to Loki:
argocd app set loki -p loki.storage.s3.accessKeyId=<access-key-id>
argocd app set loki -p loki.storage.s3.secretAccessKey=<secret-access-key>
Grafana Alloy
Similarly, we will install Grafana Alloy by appending the following configuration to apps.yaml:
- apiVersion: argoproj.io/v1alpha1
  kind: Application
  metadata:
    name: alloy
    namespace: argocd
  spec:
    project: default
    source:
      repoURL: https://grafana.github.io/helm-charts
      chart: alloy
      targetRevision: 0.4.0
      helm:
        releaseName: alloy
        values: |
          alloy:
            configMap:
              content: |
                loki.write "default" {
                  endpoint {
                    url       = "http://loki-gateway.monitoring/loki/api/v1/push"
                    tenant_id = "tenant1"
                  }
                  external_labels = {}
                }

                loki.source.kubernetes "homelab" {
                  targets          = discovery.kubernetes.pods.targets
                  forward_to       = [loki.write.default.receiver]
                }

                logging {
                  level  = "debug"
                  format = "logfmt"
                }

                discovery.kubernetes "pods" {
                  role = "pod"
                }

                discovery.kubernetes "nodes" {
                  role = "node"
                }

                discovery.kubernetes "services" {
                  role = "service"
                }

                discovery.kubernetes "endpoints" {
                  role = "endpoints"
                }

                discovery.kubernetes "endpointslices" {
                  role = "endpointslice"
                }

                discovery.kubernetes "ingresses" {
                  role = "ingress"
                }
    destination:
      namespace: monitoring
      server: https://kubernetes.default.svc
    syncPolicy:
      automated:
        prune: true
      syncOptions:
        - CreateNamespace=true
        - ServerSideApply=true
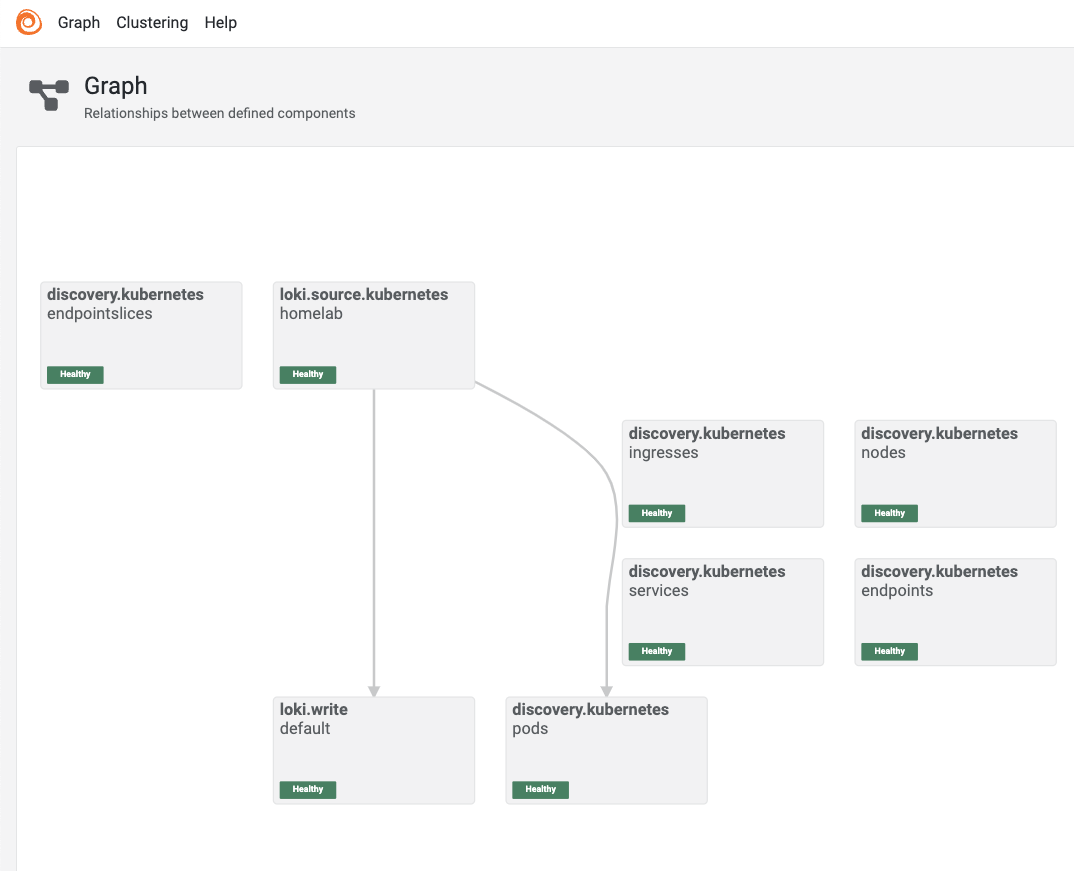
This configuration introduces several components:
- loki.write: Receives log entries from other Loki components and sends them over the network.
- discovery.kubernetes: Finds scrape targets from Kubernetes resources such as pods, services, etc.
- loki.source.kubernetes: Tails logs from Kubernetes containers using the Kubernetes API.
Apply the changes in apps.yaml to setup Loki and Alloy
kubectl apply -f apps.yaml
Testing Alloy
Alloy features a minimalistic UI. To test it, port forward your desktop PC to the Alloy service and access it through your browser.
kubectl port-forward -n monitoring svc/alloy 12345:12345
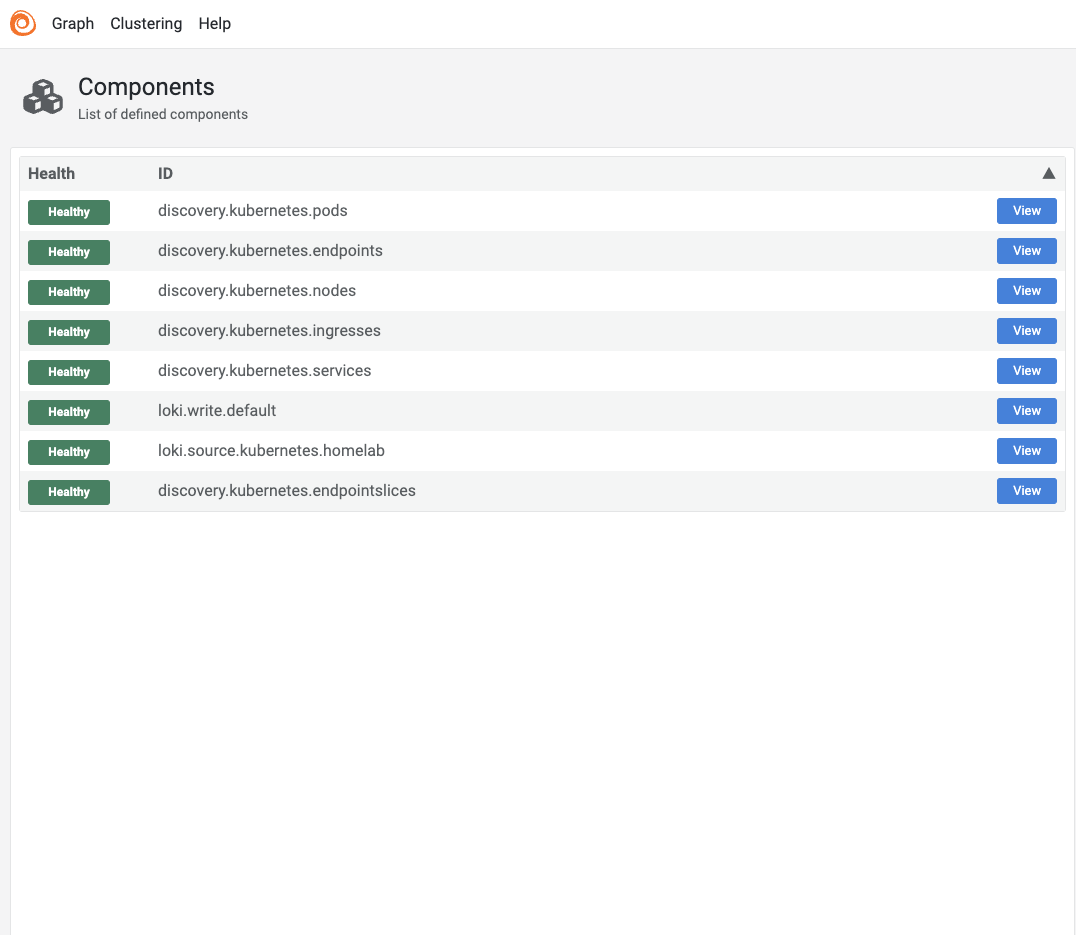
Visit http://localhost:12345 in your web browser. You should see all configured components in a healthy state.

Switch to the graph view to see how these components interact.

Exploring Logs in Grafana
Next, navigate to https://grafana.<your-domain>.com and add Loki as a data source:
- Go to
Connections > Add new connection - Select Loki and add a new data source.
- Enter
http://loki-gateway.monitoringin the connection URL field. - Click Save & Test.
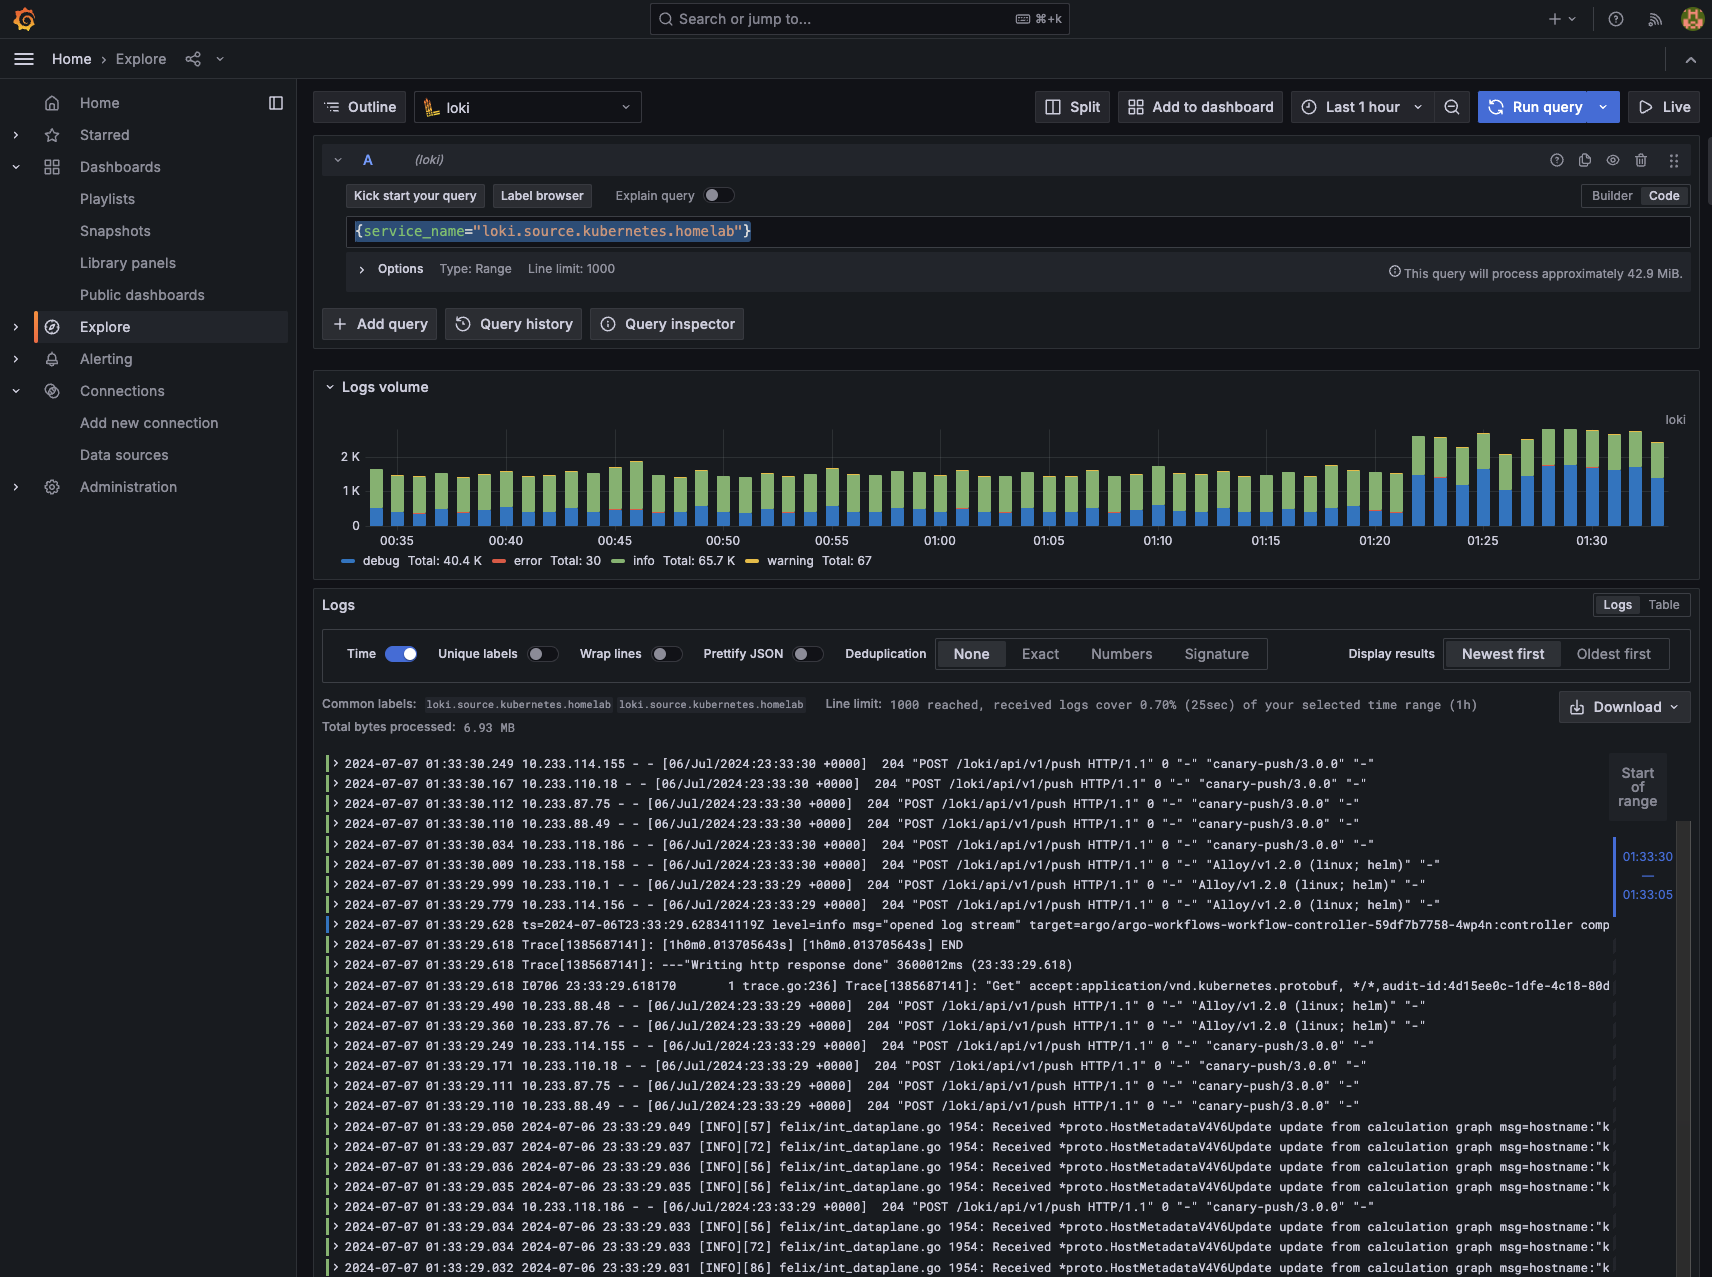
To explore logs:
- Navigate to
Explore. - Select Loki as the source.
- Enter
{service_name="loki.source.kubernetes.homelab"}as the query. - Click the Run button to view logs from all your pods.

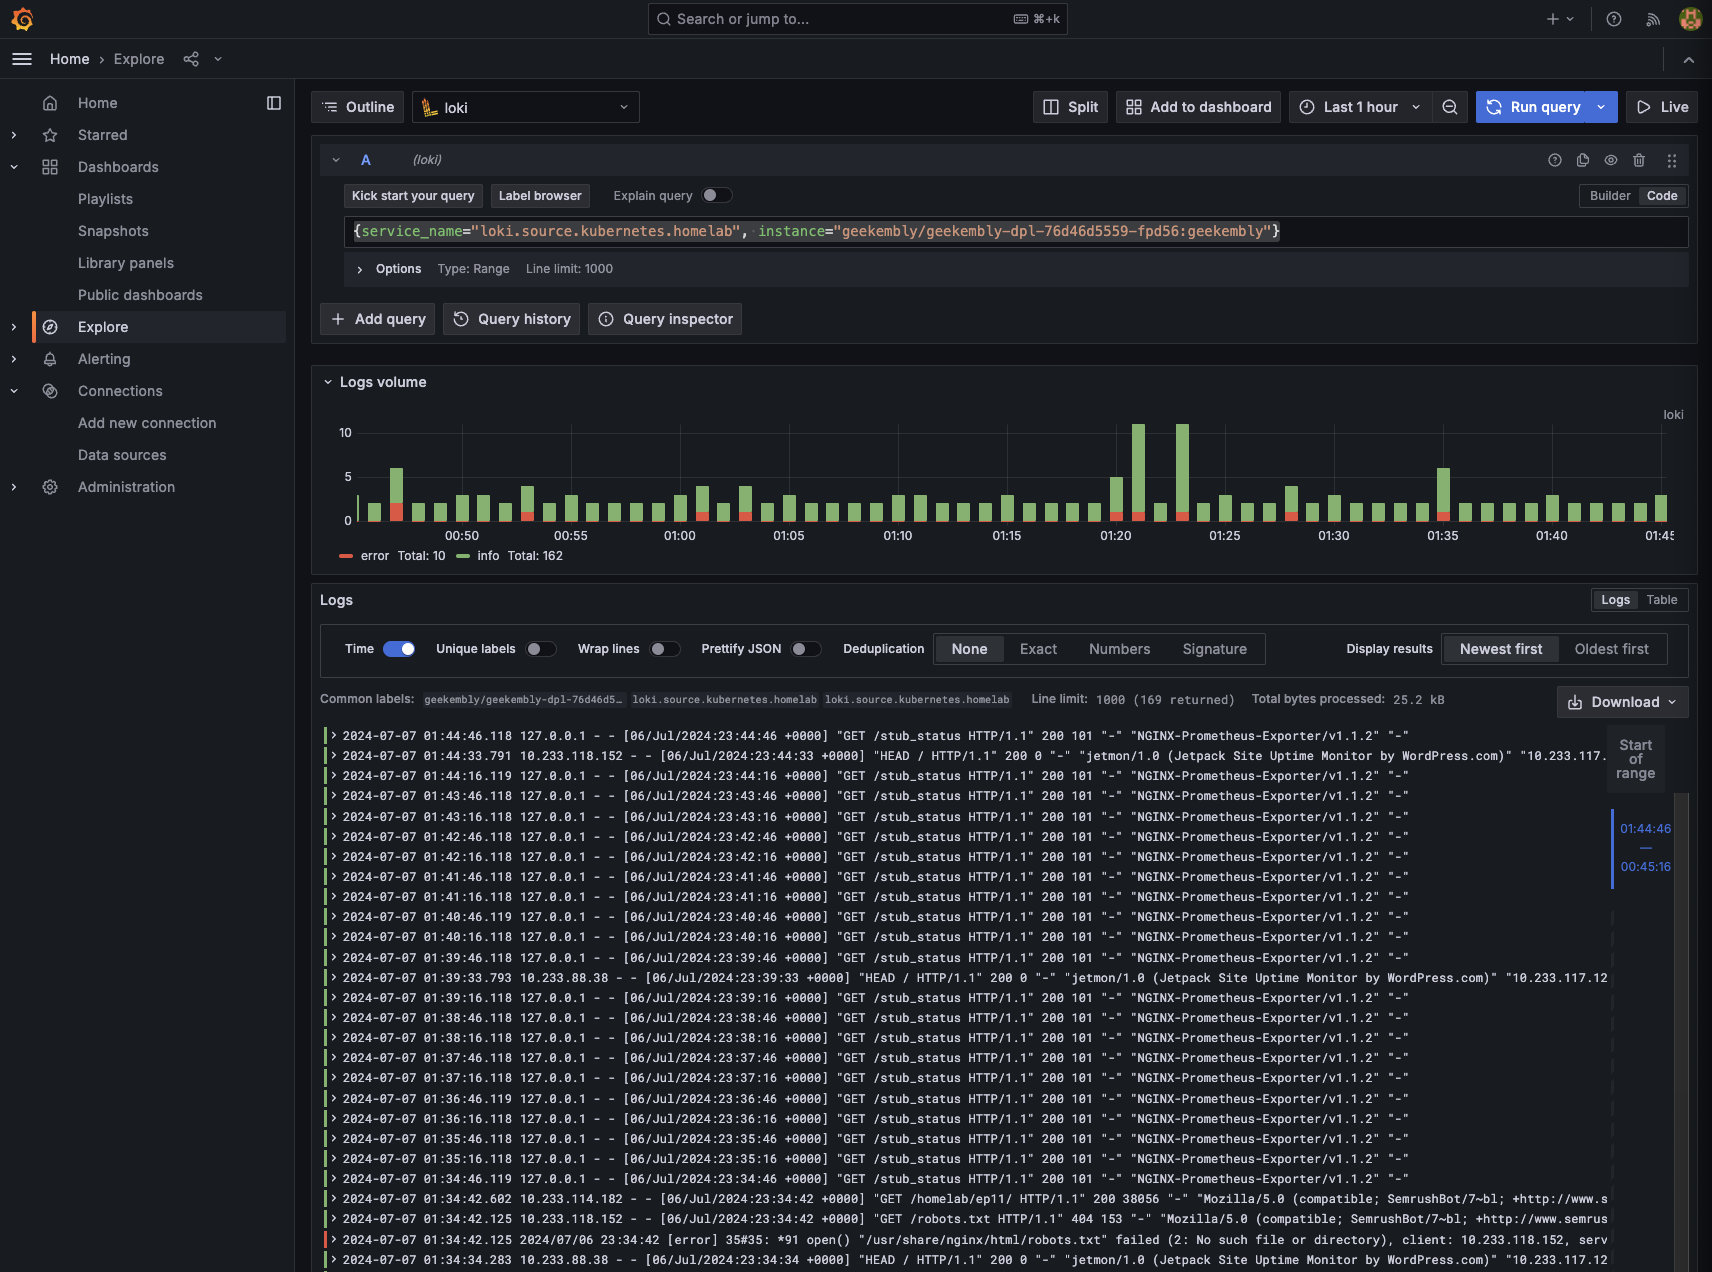
For our web log logs, we can use LogQL for more granular queries. For instance, filtering logs for our geekembly deployment using {service_name="loki.source.kubernetes.homelab", instance=~"geekembly/.*"} will display nginx logs.

Conclusion
Log management completes our home lab setup series. With this, we now have the capability to manage container logs efficiently. Throughout this series, we’ve demonstrated setting up a Kubernetes instance to deploy projects, create CI/CD pipelines, monitor logs and metrics, and set up alerts.
The only aspect we haven’t covered, which is prevalent in enterprise-level applications, is traces. Given our current stack, Jaeger could be a fitting solution. However, since our web log consists purely of static files without a backend, demonstrating Jaeger usage would be challenging. This exploration is left to the readers until I can provide a backend for our web log.
I hope this series has motivated you to delve into the technologies we’ve discussed. Thanks you for being with me in this journey. If you’ve enjoyed this, feel free to reach out to me. 🙏